Using the Dashboard of the App
Monitoring actions and seeing information about products imported and uploaded from your store are tracked and displayed by the Application Dashboard. You can view a high-level overview of the status of the monitored areas using the dashboard.
To the left of the Dashboard is a navigation bar. To view and perform different actions within a specific section, you can navigate to that section from there as well.
What Information does the Dashboard of the App Show?
The dashboard conveys data in the form of pie charts and worm graphs for the following:
Transaction Balance Sheet
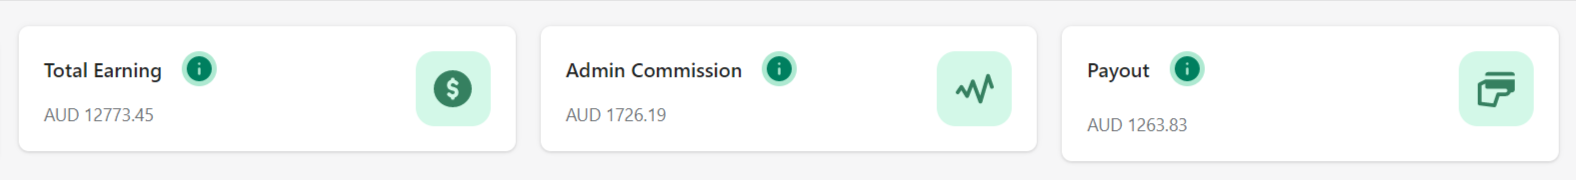
The transactional balance sheet gives you updated data on the total successful monetary transactions that have been done in the marketplace, the fees that have been calculated, and the amount that needs to be disbursed to the suppliers.
- Total Earnings: Gross sales completed in your Shopify store currency.
- Admin Commission: The fees and other charges to be deducted from the amount of the overall sales.
- Payout: The amount needs to be paid to the suppliers at the end of their billing cycle.
Products Live
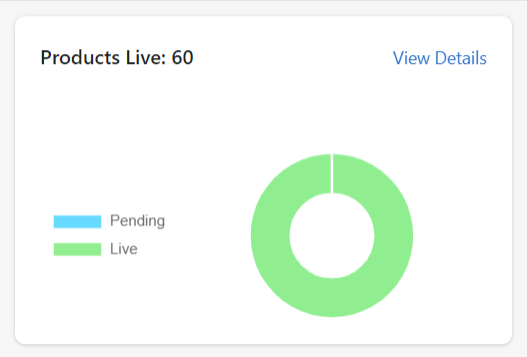
The app places all your products under 2 different statuses depending on their current status on the marketplace. The Product section uses a pie chart to give you an insight into the status of your products. Below you can find the different product statuses.
- Pending
- Live
Orders Received
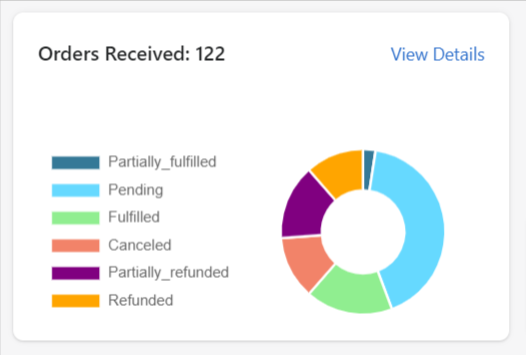
The Order section uses a pie chart to display the status of your orders. You can find three different statuses under which an order may fall. Below you can find a list of different order statuses.
- Pending
- Fulfilled
- Canceled
- Partially Fulfilled
- Refunded
- Partially Refunded
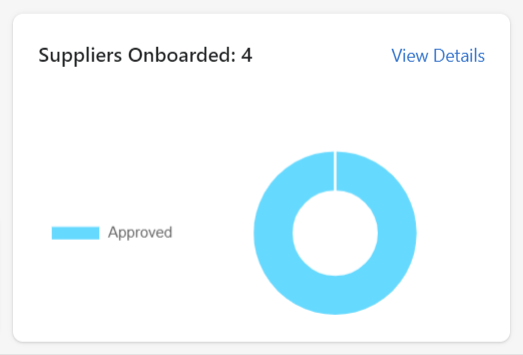
Suppliers Onboarded
The suppliers onboarded section gives you an insight into the number of suppliers that have registered on the marketplace and their current application status.
- Approved
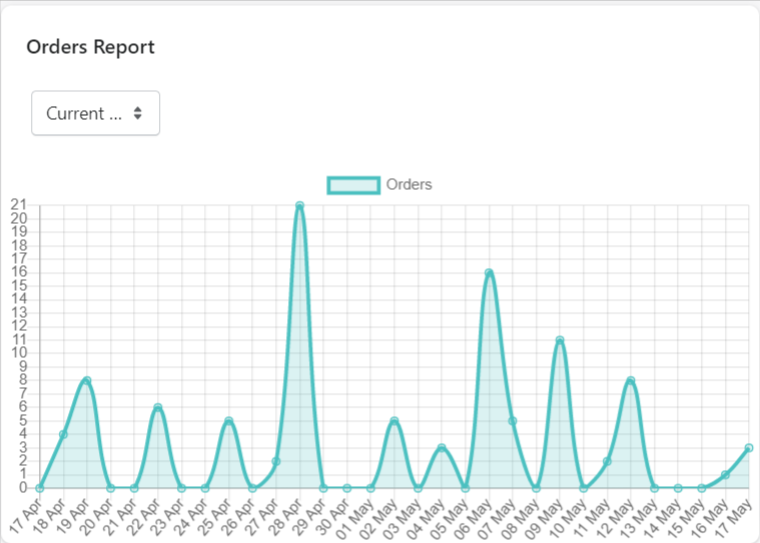
Orders Report
The orders report provides a worm graph to view all data for orders that were received on the marketplace.
The left corner of the section offers you a dropdown menu that can be used to toggle between options to view the sales record for a varied time duration. The option includes options that include stats for:
- Last 7 days
- Current month
- Last 1 year
- Last 2 years
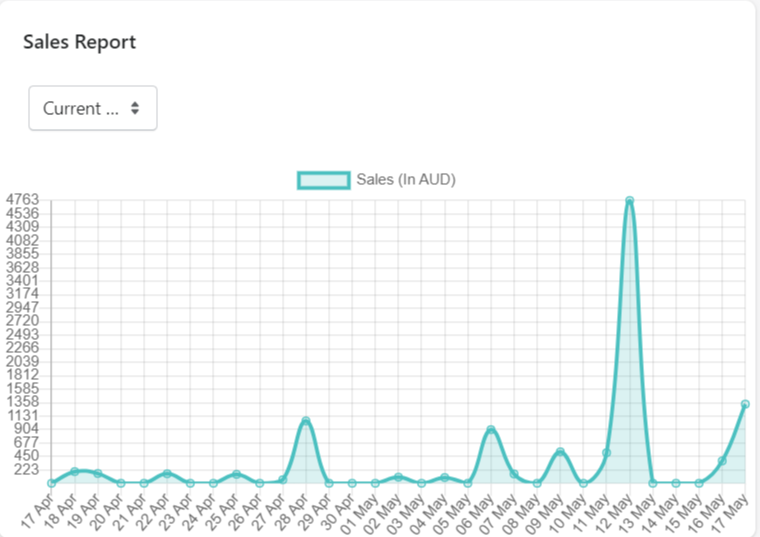
Sales Report
The sales report section on the dashboards represents the Gross Sales that were made on the Marketplace through a worm graph for your sales over a period of time.
The left corner of the section offers you a dropdown menu that can be used to toggle between options to view the sales record for a varied time duration. The option includes options that include stats for:
- Last 7 days
- Current month
- Last 1 year
- Last 2 years
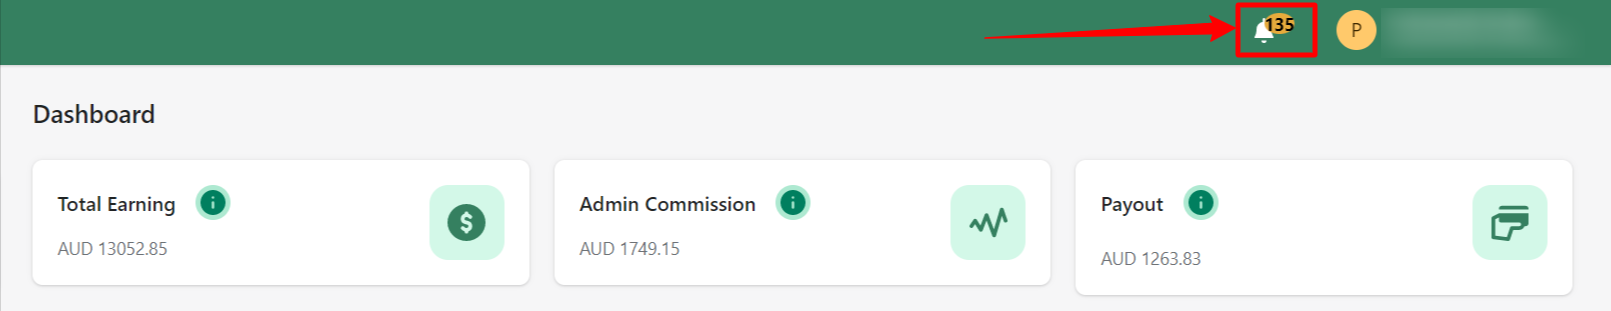
Viewing the Notifications
You can find the Notifications at the top right of your screen, which can be accessed by clicking on the bell icon. The notifications section shows you all the recent updates that have taken place in the marketplace includes products imported by suppliers, receiving new orders on the marketplace, payments requests from merchants, and others to name a few.