Dashboard of the Vendor App
The Application Dashboard tracks and displays information about monitored actions alongwith products (imported from your store or created on the vendor panel) and shares their status after uploading them to the marketplace. The dashboard also provides a high-level overview of the sales and orders over time.
The navigator panel is on the left. You can navigate to a specific section to view and perform the required actions using the navigation panel.
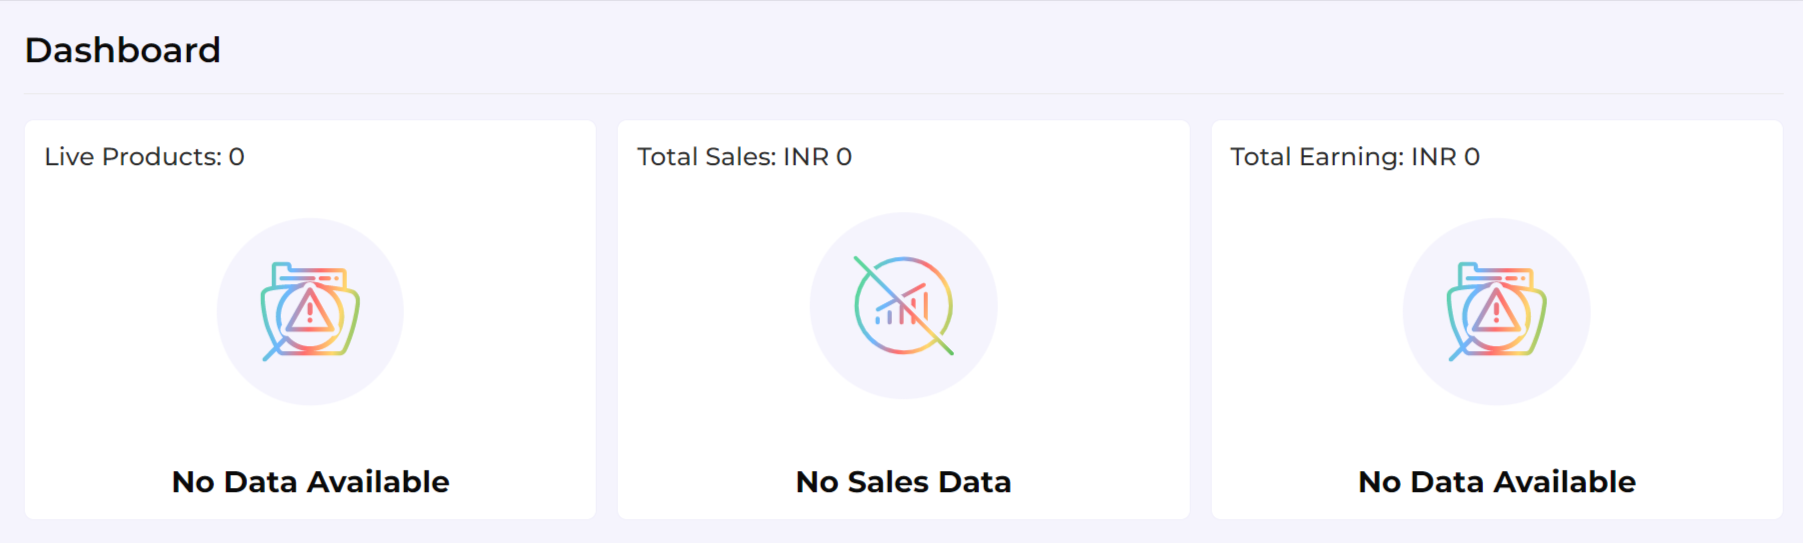
Information Dashboard of the App Show
The dashboard conveys data in the form of pie charts and worm graphs for the following:
Live Products
The app places your products under 5 different statuses depending on their current status on the App and the Marketplace. The Product section uses a pie chart to give you an insight into the status of your products. Below you can find the different product statuses.
- Live
- Pending
- Inactive
- Rejected
- Imported
Total Sales
The sales section on the dashboards represents your Gross Sales since you’ve started selling on the marketplace. Here you can view the overall sales and their bifurcation into the following statuses.
- Refunded
- Canceled
- Pending
- Fulfilled
- Partially-fulfilled
Total Earnings
The earnings section on the dashboards represents your total earnings as a vendor after deduction of all the admin charges since you’ve started selling on the marketplace. Here you can view the overall earnings divided into two parts.
- Amount Received
- Payment Due
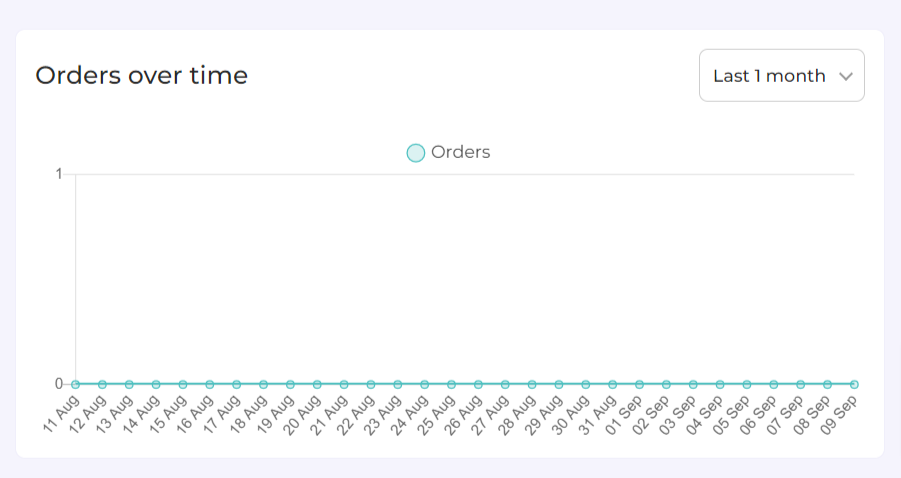
Orders Over Time
The “Orders over time” section on the dashboards represents the total orders you’ve received from the marketplace over some time through a worm graph.
The right corner of the section offers you a dropdown menu that you can use to toggle between options to view the order count for a varied time duration. The dropdown includes options to view sales records of:
- Weekly
- Monthly
- Yearly
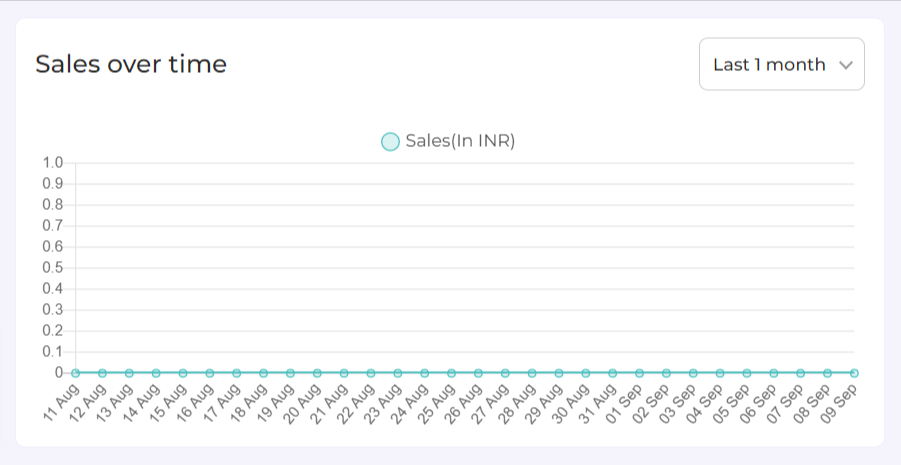
Sales Over Time
The “Sales over time” section on the dashboards represents the total sales you’ve made on the marketplace using a worm graph.
The right corner of the section offers you a dropdown menu that you can use to toggle between options to view the sales completed over a varied time duration. The dropdown includes options to view sales records of:
- Weekly
- Monthly
- Yearly